
Lightning-Generated Whistler-Mode Waves at Venus
Introduction
Venus is a strange world when compared with Earth. It has a dense CO2 atmosphere, low water content, and lacks plate tectonics and an intrinsic magnetic field. The temperature at the surface is about 700 K and the pressure is about 90 bar, but in the cloud layers, at ~45-65 km, there exist regions with temperatures and pressures more akin to Earth. This is where lightning is most likely to occur.
Lightning produces an extremely low frequency (ELF) radio wave, known as a whistler-mode wave, that can propagate along magnetic field lines to reach a spacecraft, such as Venus Express (VEX), at higher altitudes. Venus lacks an intrinsic dipole magnetic field, but the interplanetary magnetic field (IMF) drapes around the planet, forming a comet-like tail. The IMF induces currents in the ionosphere which generate an opposing field. The field lines tend to be horizontal to the surface around much of the planet, except in the tail where it is more radial (Figure 1). On the dayside, there must be some radial component to the field in order for whistlers to be guided to higher altitudes. Therefore, a wave is less likely to enter the ionosphere at the zenith of its source and more likely to enter at angles toward the horizon, where the field lines and wave path are more aligned. On the nightside, this requirement is more readily met with the draping IMF.
The periapsis of Venus Express was near the North Pole. It changed ~3º per year in latitude and ranged from 165 to 400 km in altitude. The solar zenith angle spanned 73º to 107º, a 34º range along the noon-midnight meridian. These high latitudes only allowed Venus Express to observe a modest radial component of the field on the nightside. The longitude of the ascending node was fixed in inertial space, so it swept through all local times in one Venus year, or ~225 Earth days.

Whistler Propagation
Whistler-mode waves are transverse, right-hand circularly polarized electromagnetic waves that propagate below the local electron gyrofrequency along magnetic field lines. The field at Venus is parallel to the surface around much of the planet, but in the tail there is a strong radial component providing a path for whistlers to propagate up to the spacecraft (Figure 1). At other locations, the horizontal field could dip into the atmosphere to pick up the waves. When a wave enters the ionosphere, where it can be measured by a spacecraft, the wave front flattens due to the increasing index of refraction and the normal bends vertically (Figure 2). The energy density of the waves is expected to dampen only slightly with increasing altitude. Pioneer Venus (PVO) estimates of Poynting flux show this damping as a function of altitude, indicating that the waves came from below the ionosphere (Figure 3). We expect the same trend for VEX observations of whistlers.


Signal Analysis
The dual fluxgate magnetometer onboard Venus Express was able to detect ELF signals up to 64 Hz at various altitudes throughout the mission. For each orbit, we Fourier analyzed all data below 800 km in 1-second intervals shifted by 1/8 of a second. We then calculated the coherence, ellipticity, propagation angle, and the transverse and compressional powers. Our criteria to identify whistlers are the coherence between the minimum and intermediate variance components must be greater than 0.3, the ellipticity must be greater than 0.5, the propagation angle less than 45º, and the transverse power must be greater than the compressional power. A mask is created to filter out anything in the dynamic spectra that does not fulfill these criteria for at least one second in time and 6 Hz in frequency. Figure 4 shows one of the longer signals observed by Venus Express. In this analysis, the constraints on ellipticity and propagation angle are the most significant. We analyzed all available data within the ionosphere in search of lightning-generated whistler-mode waves. The mission was in orbit from 2006 to 2014 and in that time there were over 17 cumulative hours of whistler observations, ~13 hours below 400 km altitude. Cases with prolonged activity imply a magnetic connection to an electrical storm. This results in many whistlers muddling together into the appearance of one long signal. Whistlers at Venus extend up to hundreds of Hertz in frequency, but we are only able to observe the band below 64 Hz, therefore we don’t see the typical dispersion that uniquely identifies whistler-mode waves.

Statistics
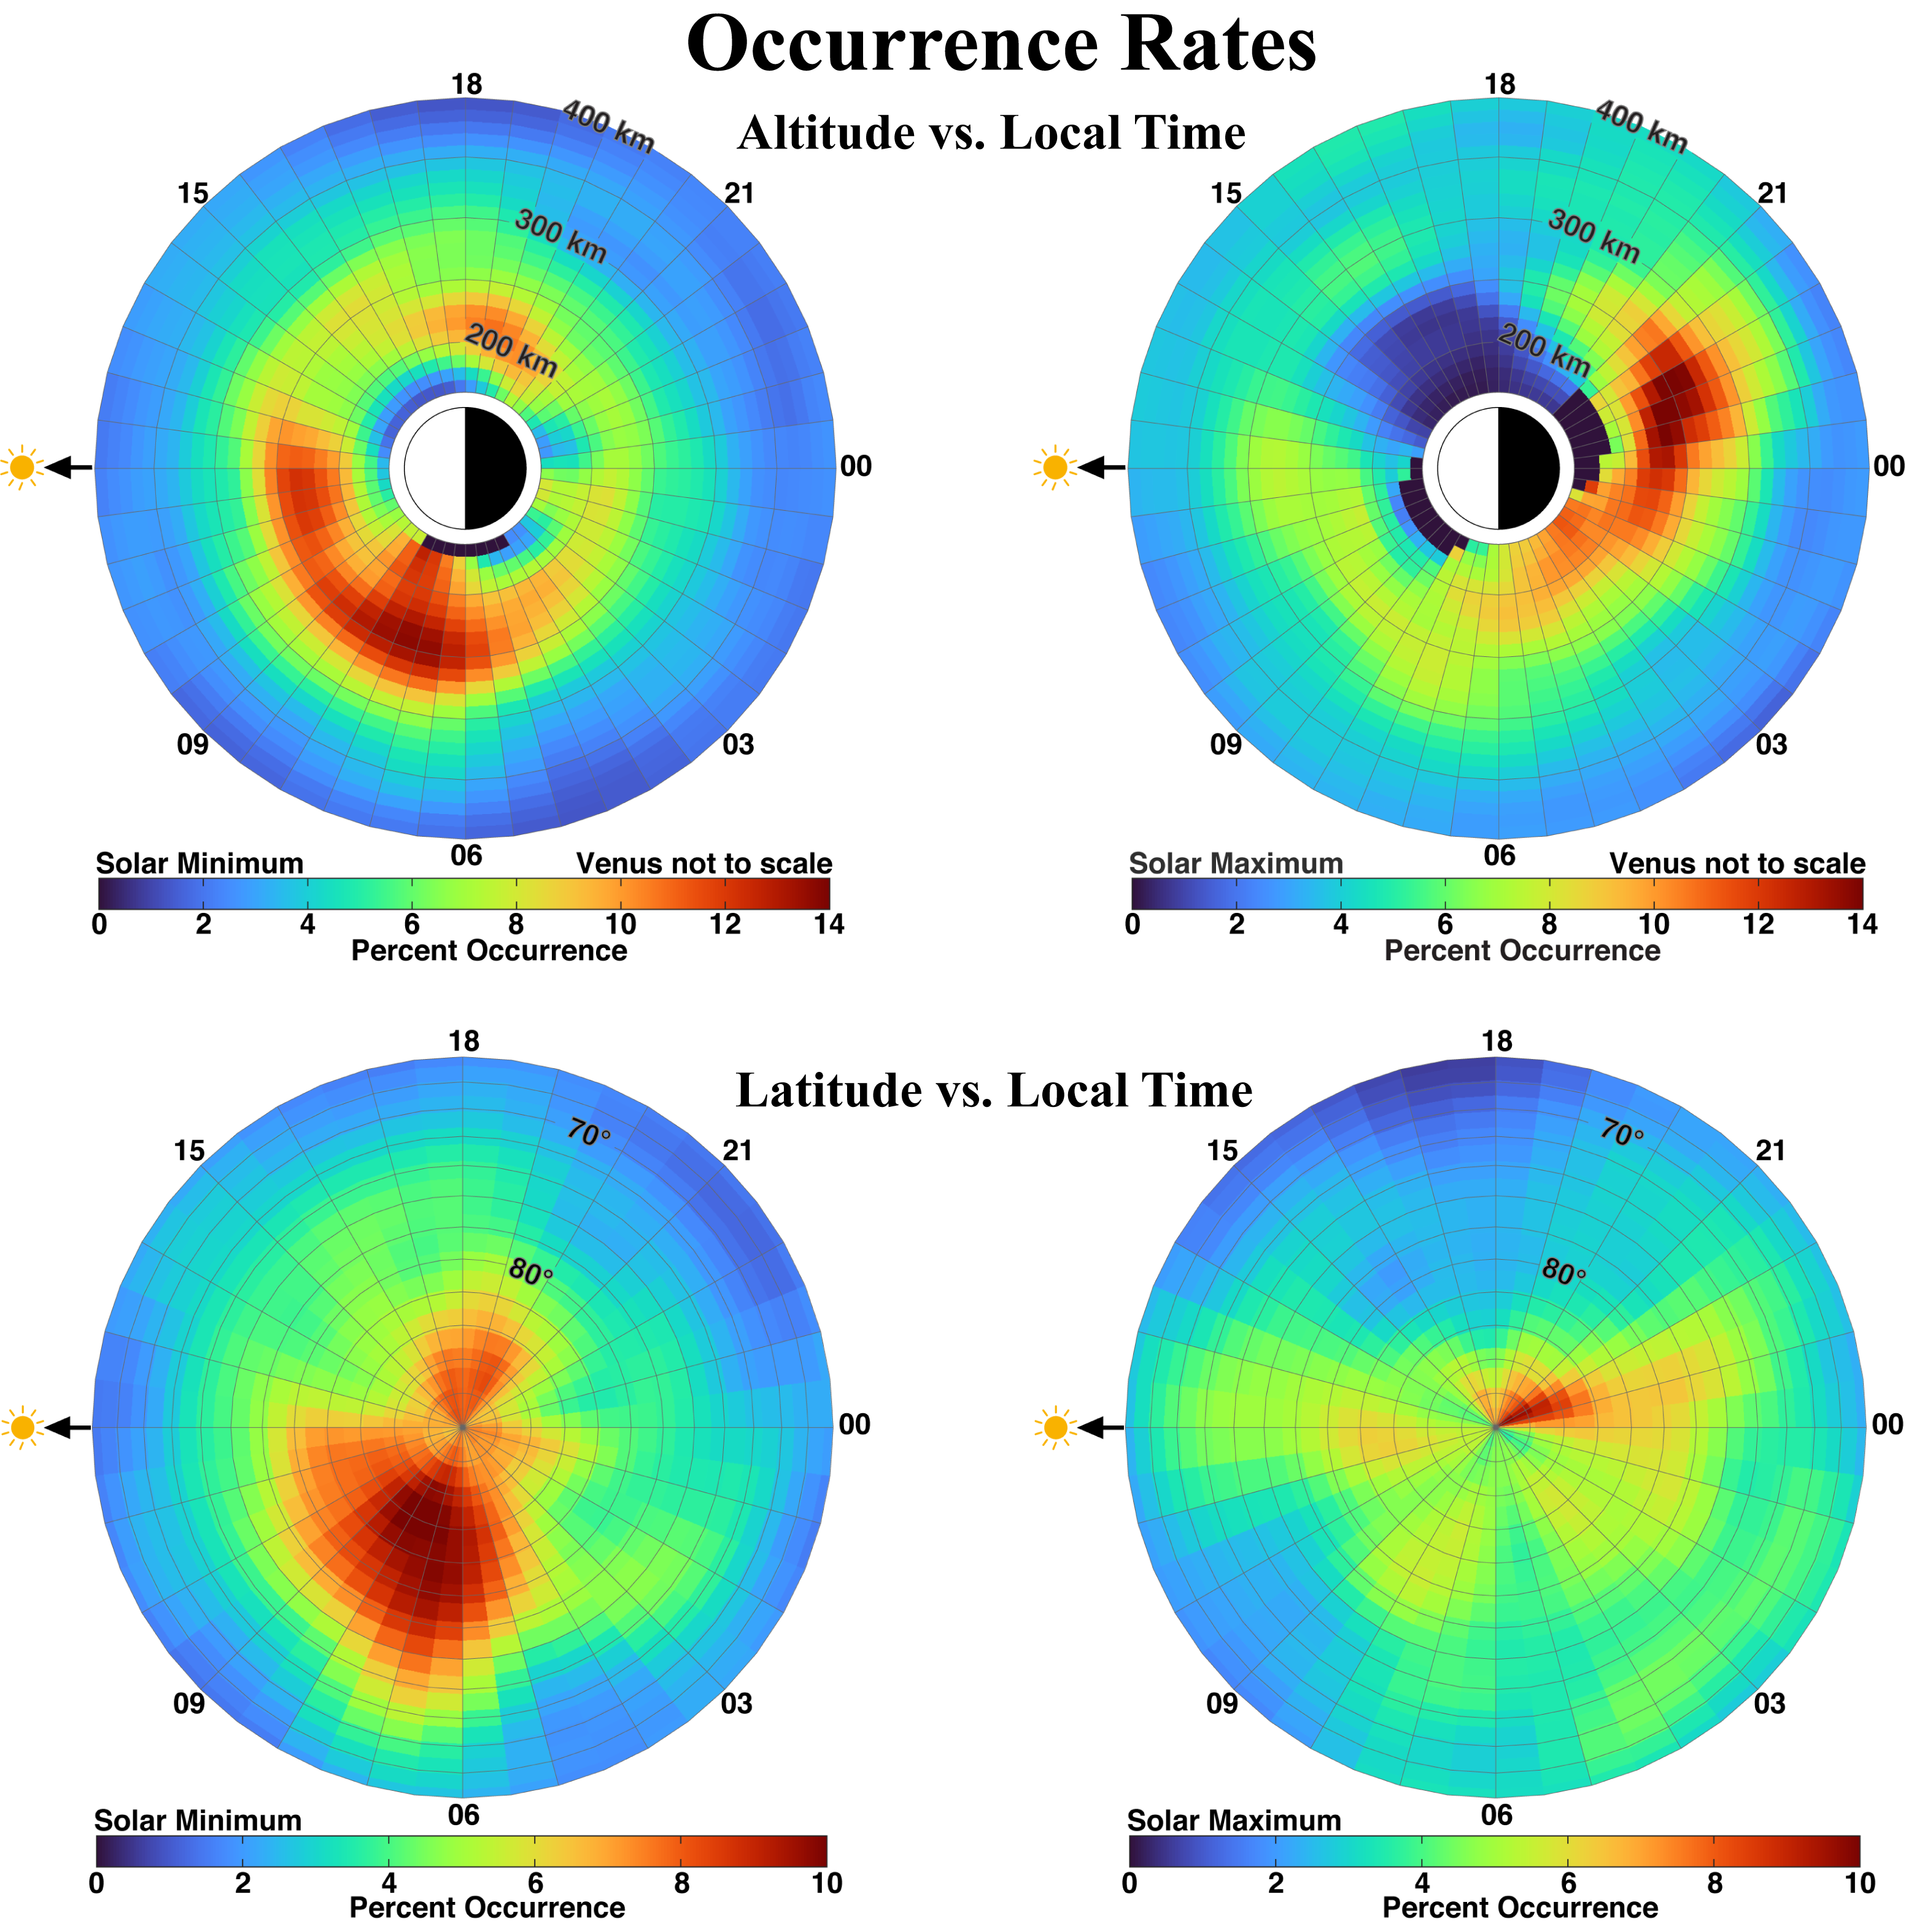
We have examined the Venus Express 128 Hz magnetic field data in search of whistlers below 800 km altitude. Figure 6 shows the occurrence rates of whistler observations as a function of altitude with local time on top and latitude with local time on the bottom. The left column is during the solar minimum period and the right column is during solar maximum. Most of the signals (75%) were detected when the spacecraft was between 200 to 350 km altitude. On average, whistlers were detected over 5% of the time throughout the mission. During solar minimum, observations were about twice as frequent compared to solar maximum. At 250 km, ELF waves were observed 8% of the time-averaged over all local times. There is a peak in the post-dawn sector that is evident in both the altitude and latitude plots for solar minimum. This is due to an increased radial component in the draping of the magnetic field (Figure 7). There is not necessarily more lightning activity in this region, it is simply that the field guidance is much stronger here and allows more signals to be detected. When the ionosphere is strongly magnetized, as it often is during solar minimum, plasma flow anisotropies produce a strong Y-component to the field on the dawn side, which translates to a strong radial component in that region (Villarreal et al., 2015). This field configuration provides the path necessary for whistlers to reach Venus Express in the ionosphere. During solar maximum, there is a slight preference for detections on the nightside, which is what we expect due to the radial field.

Poynting Flux Calculation
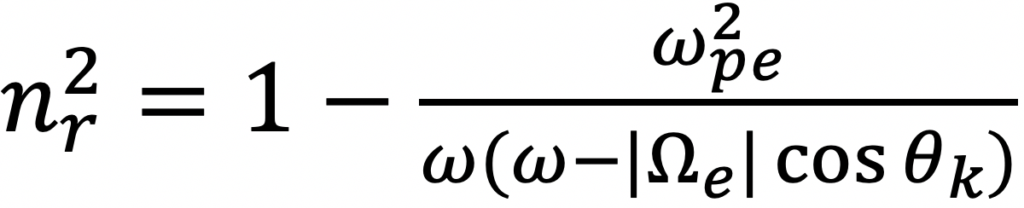
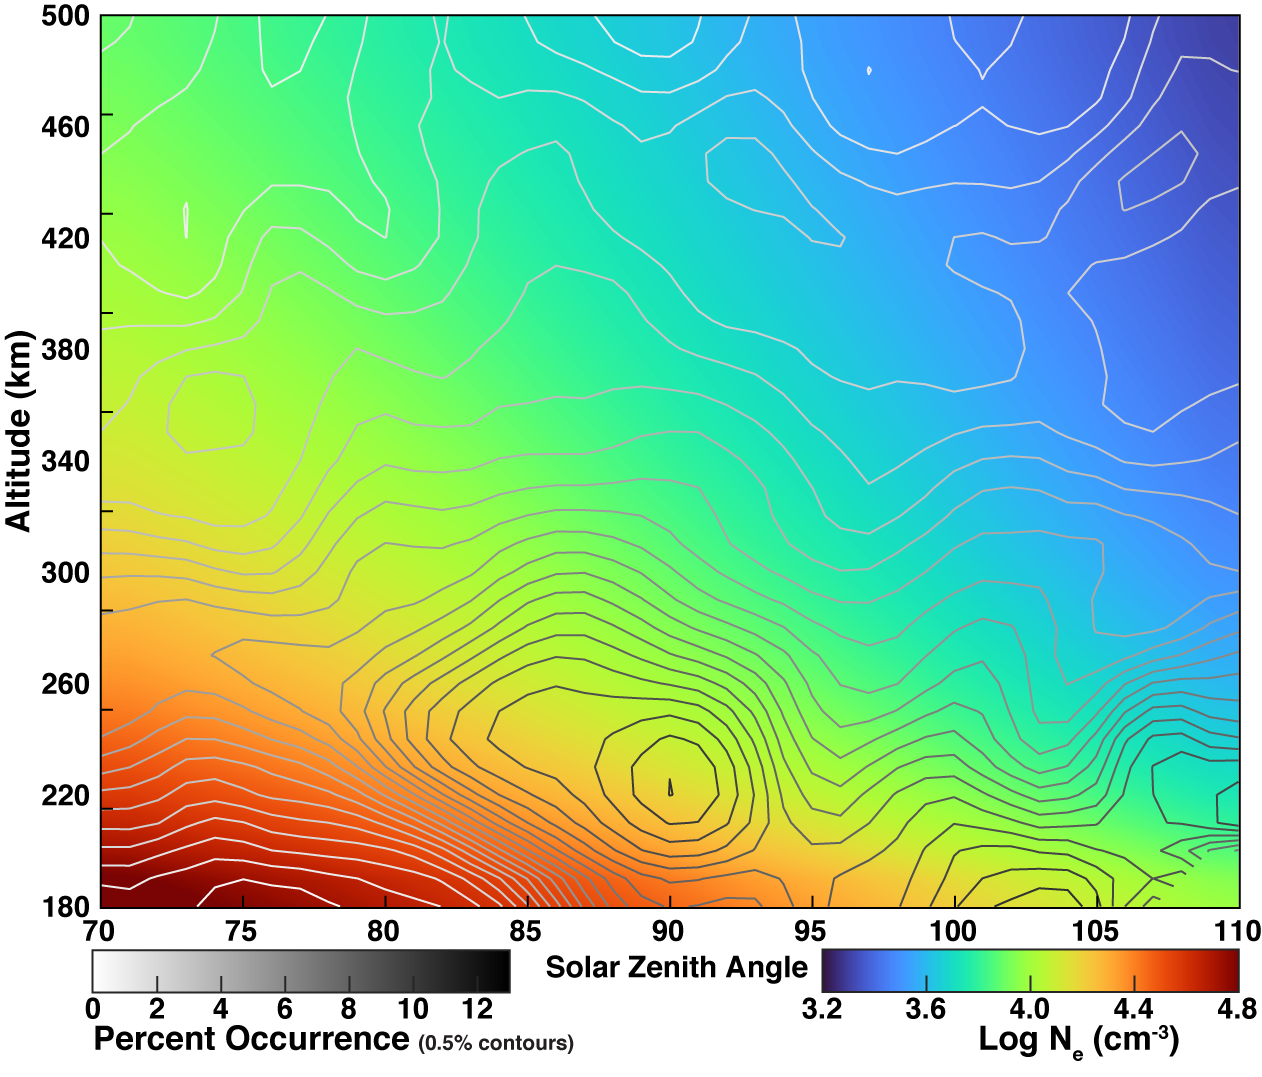
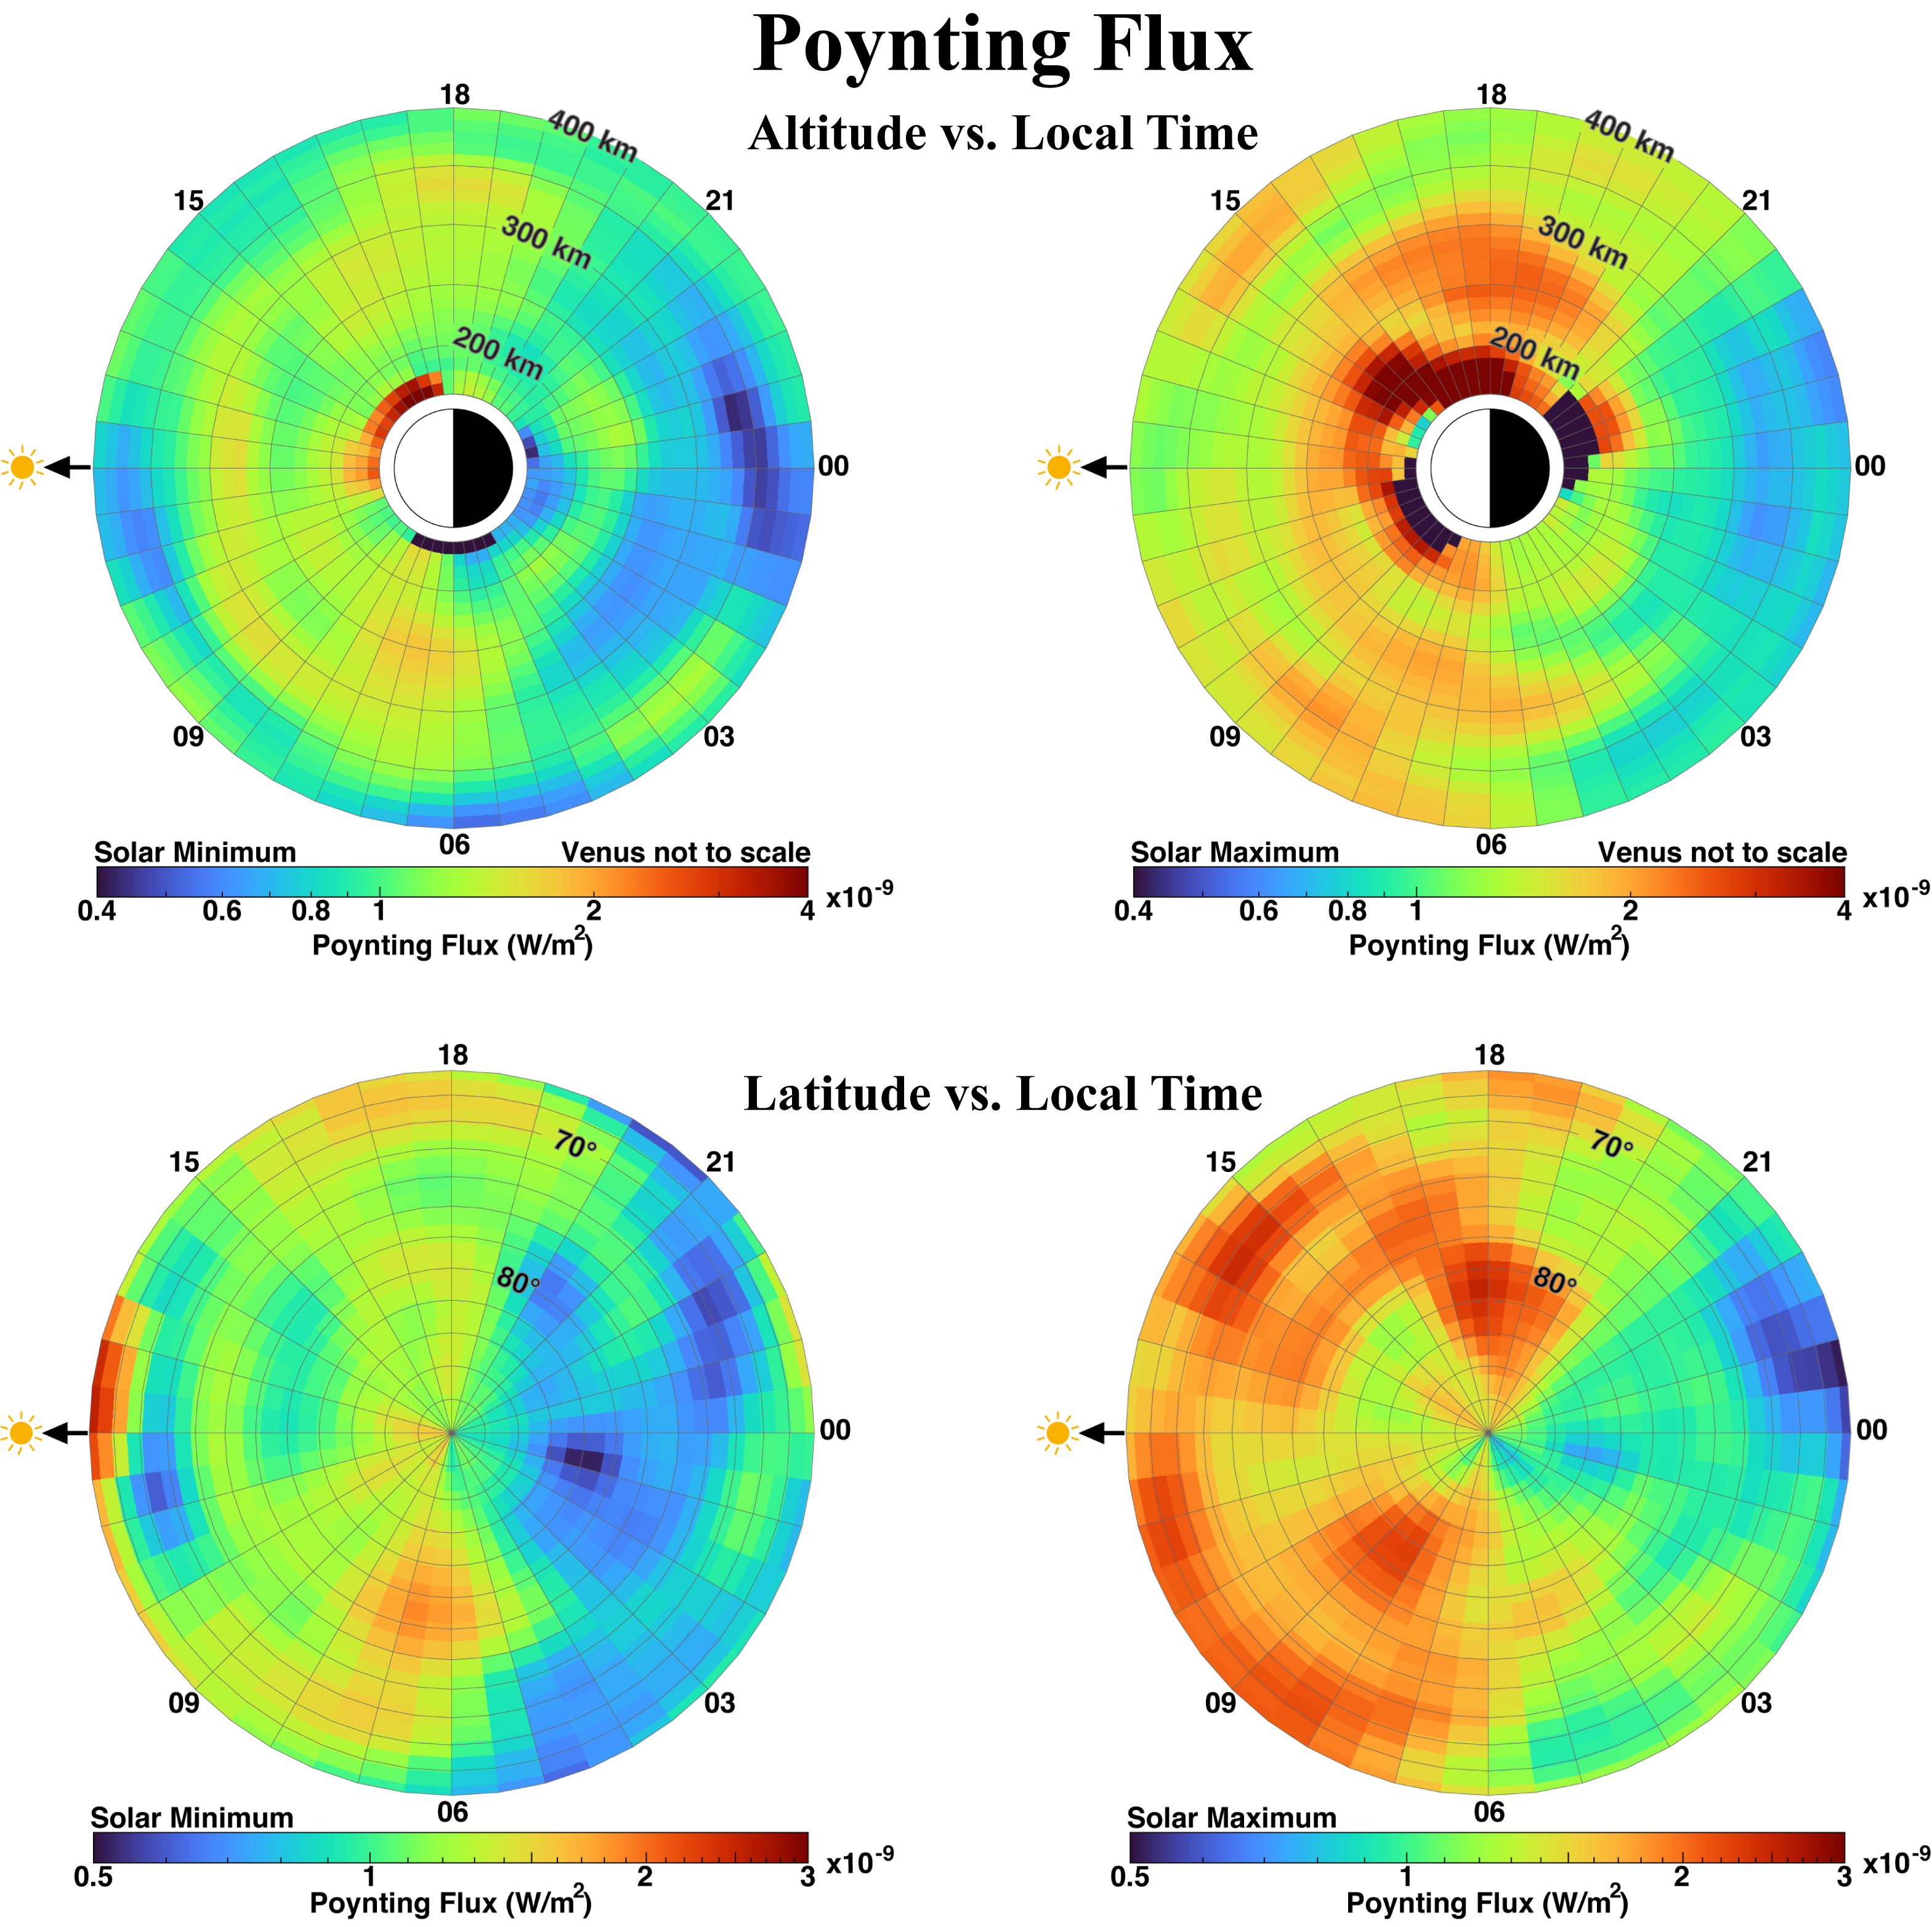
To calculate the Poynting flux we need the 3 components of the wave magnetic field and the 3 components of the wave electric field, but Venus Express did not carry an electric field sensor. We can infer the wave electric field if we know the phase velocity of the wave (Equation 1). To determine the phase velocity, we need to know the index of refraction of the ionosphere (Equation 2). In order to calculate the index of refraction we need to know the electron density, but Venus Express did not have electron density measurements collocated with these whistler observations. We have taken the VIRA ionospheric model (Brace et al., 1997) and scaled it for solar EUV. The contours in figure 8 show the statistics of whistler observations as a function of solar zenith angle and altitude. The color is the electron density from the VIRA model. This provides us with a good estimate of the index of refraction for each observation. Figure 9 shows histograms of the median Poynting flux in the same format as figure 6. There is an afternoon peak during solar minimum and a morning peak during solar maximum that are the result of a handful of strong signals. Otherwise, the energy density of the waves decreases with altitude, in agreement with the Pioneer Venus study by Russell et al. (1989).

Summary
The Venus Express fluxgate magnetometer detected lightning-generated whistler-mode waves throughout its 8.5 year campaign. We have demonstrated that these waves exhibit all the properties of whistler-mode waves. They were most frequently observed near 250 km altitude, about 8% of the time on average. Typical Poynting flux values of 10-9 W m-2 agree with previous studies on Pioneer Venus. The observations in this study only indicate where the waves are most likely to be observed, but not where the source lightning is located. Because of the field guidance of these waves, the field configuration introduces an observation bias. Next we will employ ray tracing methods to geolocate the source of each storm.
References
Brace, L.H. et al. (1997). Adv. Space Res., 19: 1203-1212.
Russell, C. T. et al. (1989). Res. Lett., 16, 579–582.
Russell, C.T. et al. (2013). Icarus, 226, 1527–1537.
Villarreal, M. N. et al. (2015). J. Geophys. Res. Space Physics, 120, 2232–2240.